Finding Edge With Flash Research
Published July 12, 2023
Flash Research is a powerful database app that enables us to have a better understanding of the stocks we trade. We can analyze lots of different parameters and find edge (or lack of it) in areas that we could not before.
In this article we are going to break down $BAOS, a ticker that has recently caught the attention of small-cap traders, and we are going to dive into its statistics and data to look for a significant edge.
Company Overview
First of all, let's understand the company,

As we can see, $BAOS is an online marketing solution provider based in China, specializing in connecting advertisers with online media and offering various advertising services. The company has a workforce of 128 employees.
Taking a look at the financial data, we can also see several insights that can help us to have a wider picture of the company:
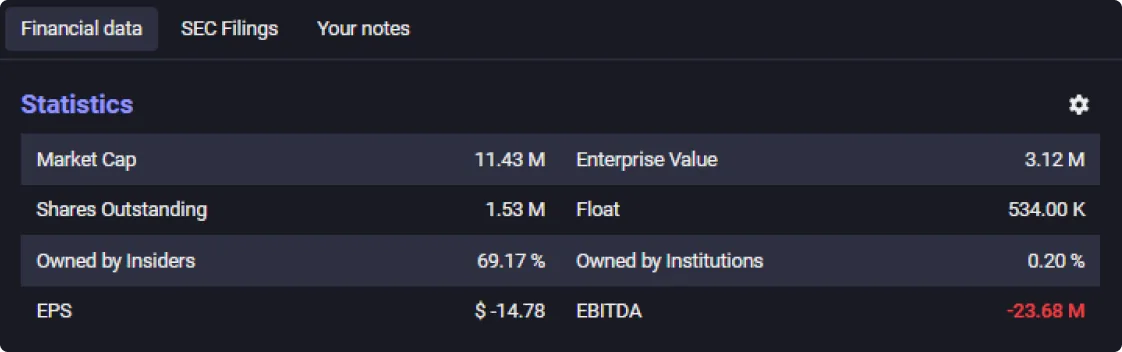
- Market Capitalization: The company has a market capitalization of $12.28 M, indicating the total value of all outstanding shares multiplied by the current market price per share.
- Enterprise Value: The enterprise value stands at $3.96 M, implying that in addition to the market capitalization, net debt and available cash have been taken into account.
- Ownership Structure: The data indicates that insiders hold 69.17% of the shares, suggesting a high level of internal ownership and control. Additionally, we can see that institutions own 0.20% of the shares.
- Shares Outstanding and Float: There are 1.53 M shares outstanding, with 534,000 shares available for trading in the market (float). This may have implications for share liquidity and volatility.
- Financial Performance: The EBITDA of -$23.68 M indicates that the company has experienced operational losses before taxes, interest, depreciation, and amortization. The EPS of -$15.47 implies a loss per share.
Based on this information, two specific items have captured our attention as day traders:
1. High insider ownership, while it's pretty common in foreign stocks to have this characteristic, it's something to take into account because they can take advantage of a higher price to dump shares and increase supply.
2. Extraordinarily low float, 534,000 tradable shares is a very limited inventory and it can be a catalyst to sharp price moves in short timeframes.
Historical Behavior
Now that we know what kind of company we are confronting, we are going to see how it usually behaves when there's attention:
Firstly, upon analyzing the chart, a consistent pattern emerges where the stock experiences downward movement after each upward run. Furthermore, the broader trend indicates a bearish sentiment, reflecting the lack of conviction among traders and investors regarding its long-term performance.
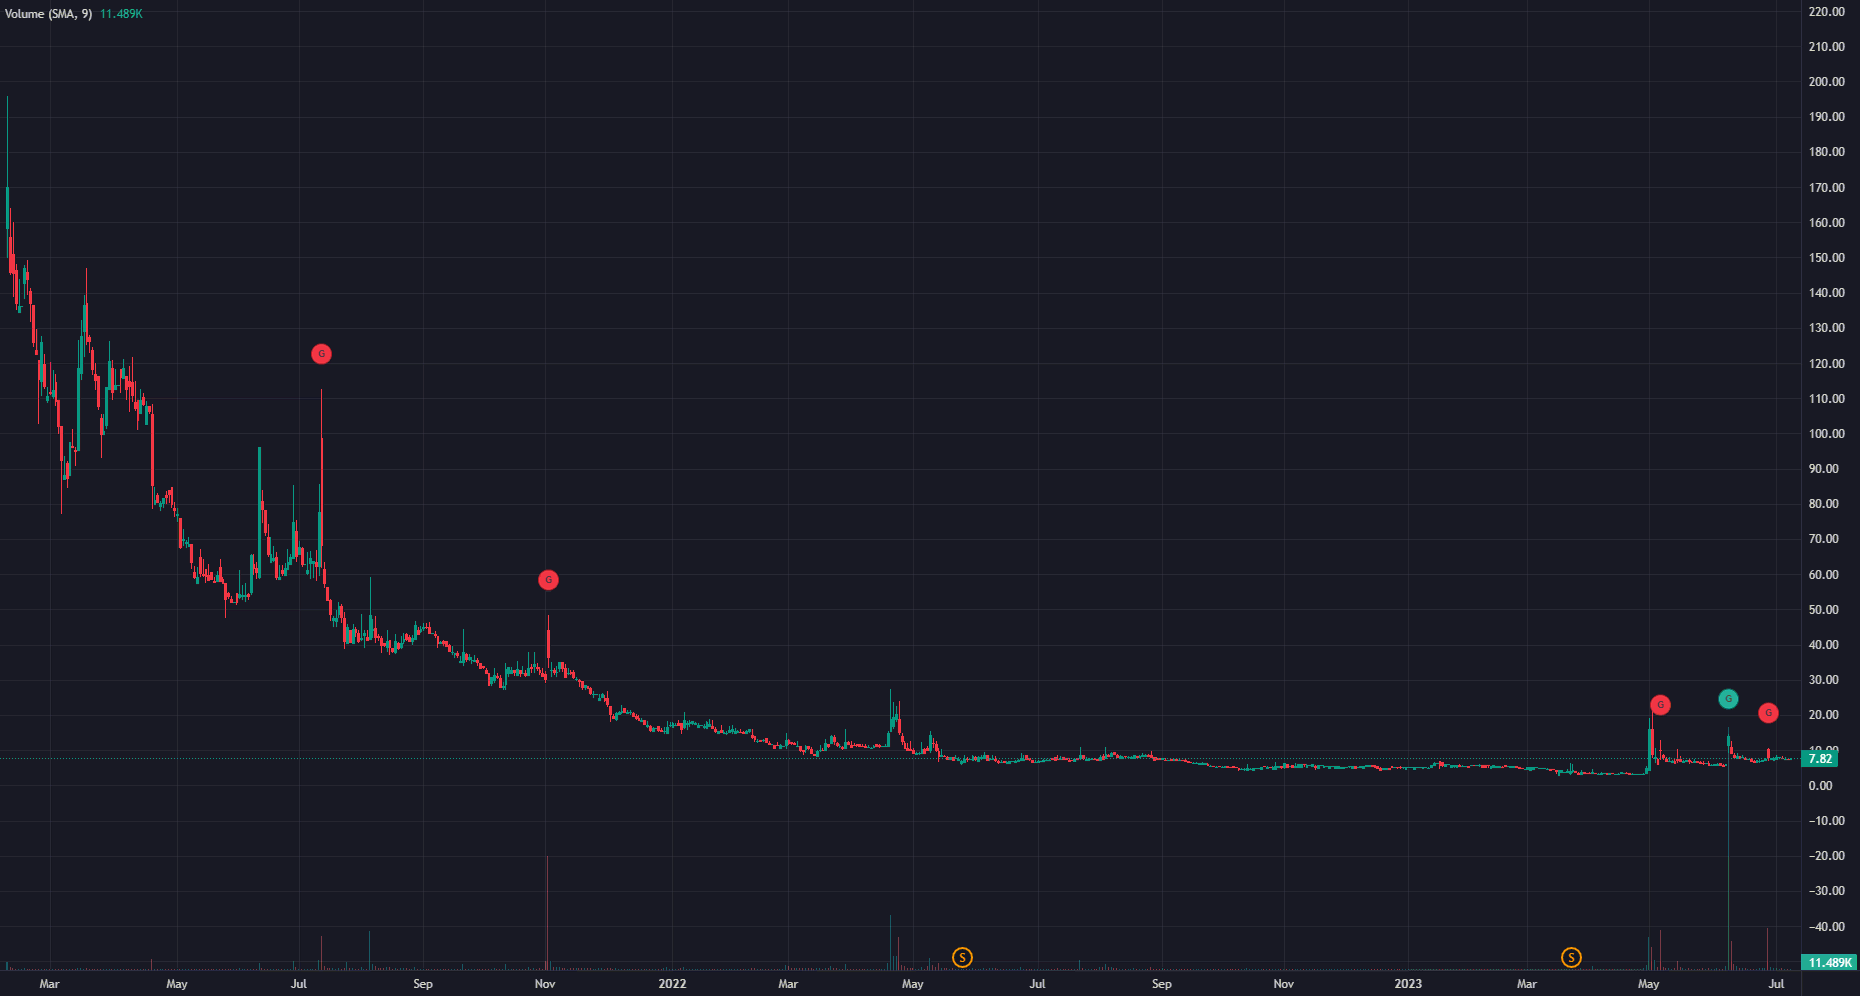
As small-cap traders, we like to see this kind of chart because they suggest a very predictable pattern. Big picture is our friend and in this case it is crystal clear, so we start thinking about shorting this stock, but we need more detailed information, let's move onto more specific data:
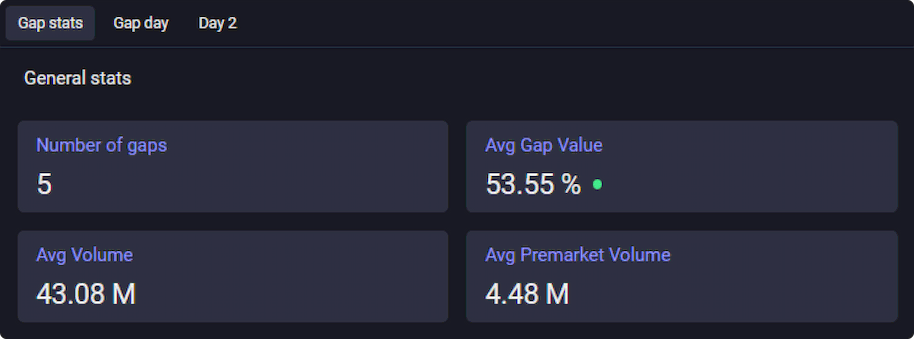
We can see that $BAOS had five gap-up days with the following characteristics:
- 53.55% average gap.
- 43.08 M of average volume.
- 4.48 M of average premarket volume.
Using these general statistics can help us to understand more about the big picture, but we can delve much deeper and see what this stock specifically does on the gap day and the day after.
Gap Day Statistics
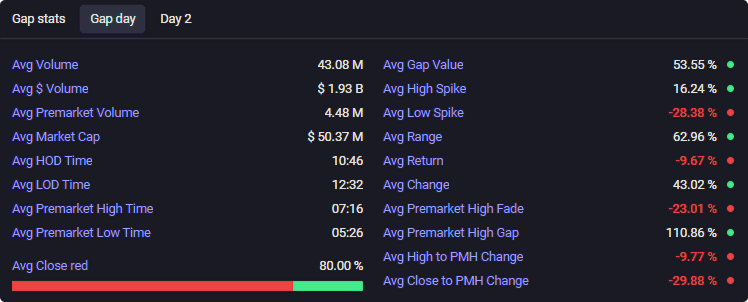
Here we can find some interesting patterns. On average, when there is a spike from the opening to the intraday high, it tends to be around 16.24%. Conversely, there is an average low spike of -28.38%, indicating substantial price decreases from the opening to the intraday low, suggesting us a possible target if we are short. Moreover we could take into account the average premarket high fade, that in this case suggests a -23.01% from the PMH (premarket high) until LOD (low of day).
The average return for gap days is -9.67%, suggesting a downward movement compared to the opening price. However, the average change is a notable 43.02%, which means that it is not typical to see round-trips.
Examining the timing, the average time for reaching the intraday high (HOD Time) is 10:46 AM, while the average time for reaching the intraday low (LOD Time) is 12:32 AM. We also can see the average premarket high time is 7:16 AM and the average premarket low time is 5:25 AM.
This information can be very valuable for timing entry and exit points in our trading.
Additionally, it's worth noting that there is, based on its history, an 80% chance of a red close on a gap day. This high percentage of red closes further emphasizes the prevalent downward trend and suggests short selling strategies.
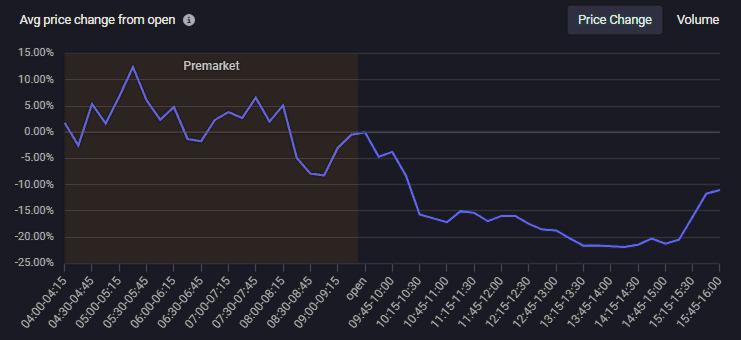
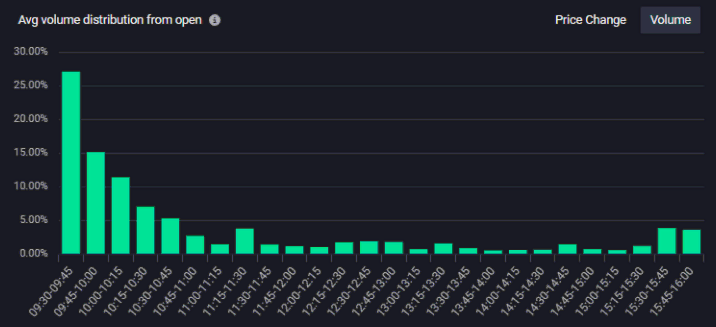
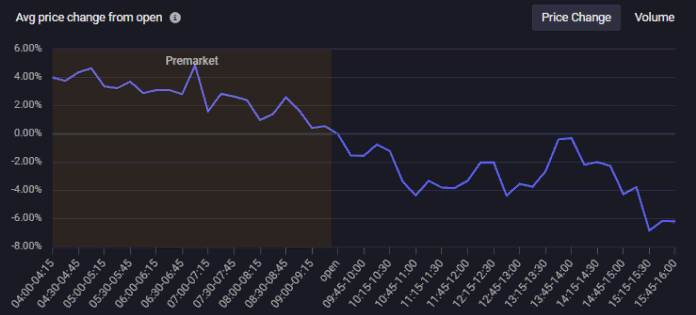
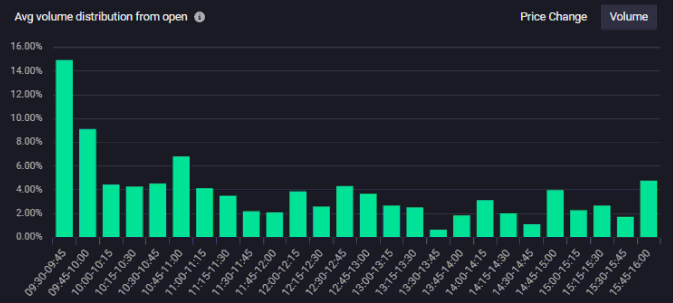
We can also visualize this behavior on these charts. They represent the average move of all gap days combined, showing the typical behavior observed in these instances.
Day 2 Statistics
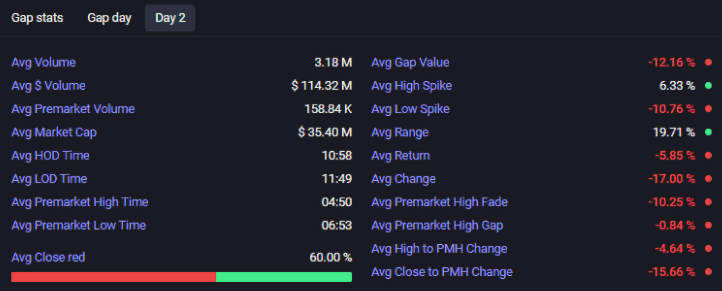
If we want to trade the day after the gap, we could also find interesting patterns using similar information as for the gap day.
In this case, we can see that volatility tends to be lower on day 2, they also tend to fade, leaving a less aggressive 6.33% spike and a good -10.76% low spike from open. We can also emphasize volume, which is usually significantly lower than in the gap day.
Exploring other $BAOS gaps
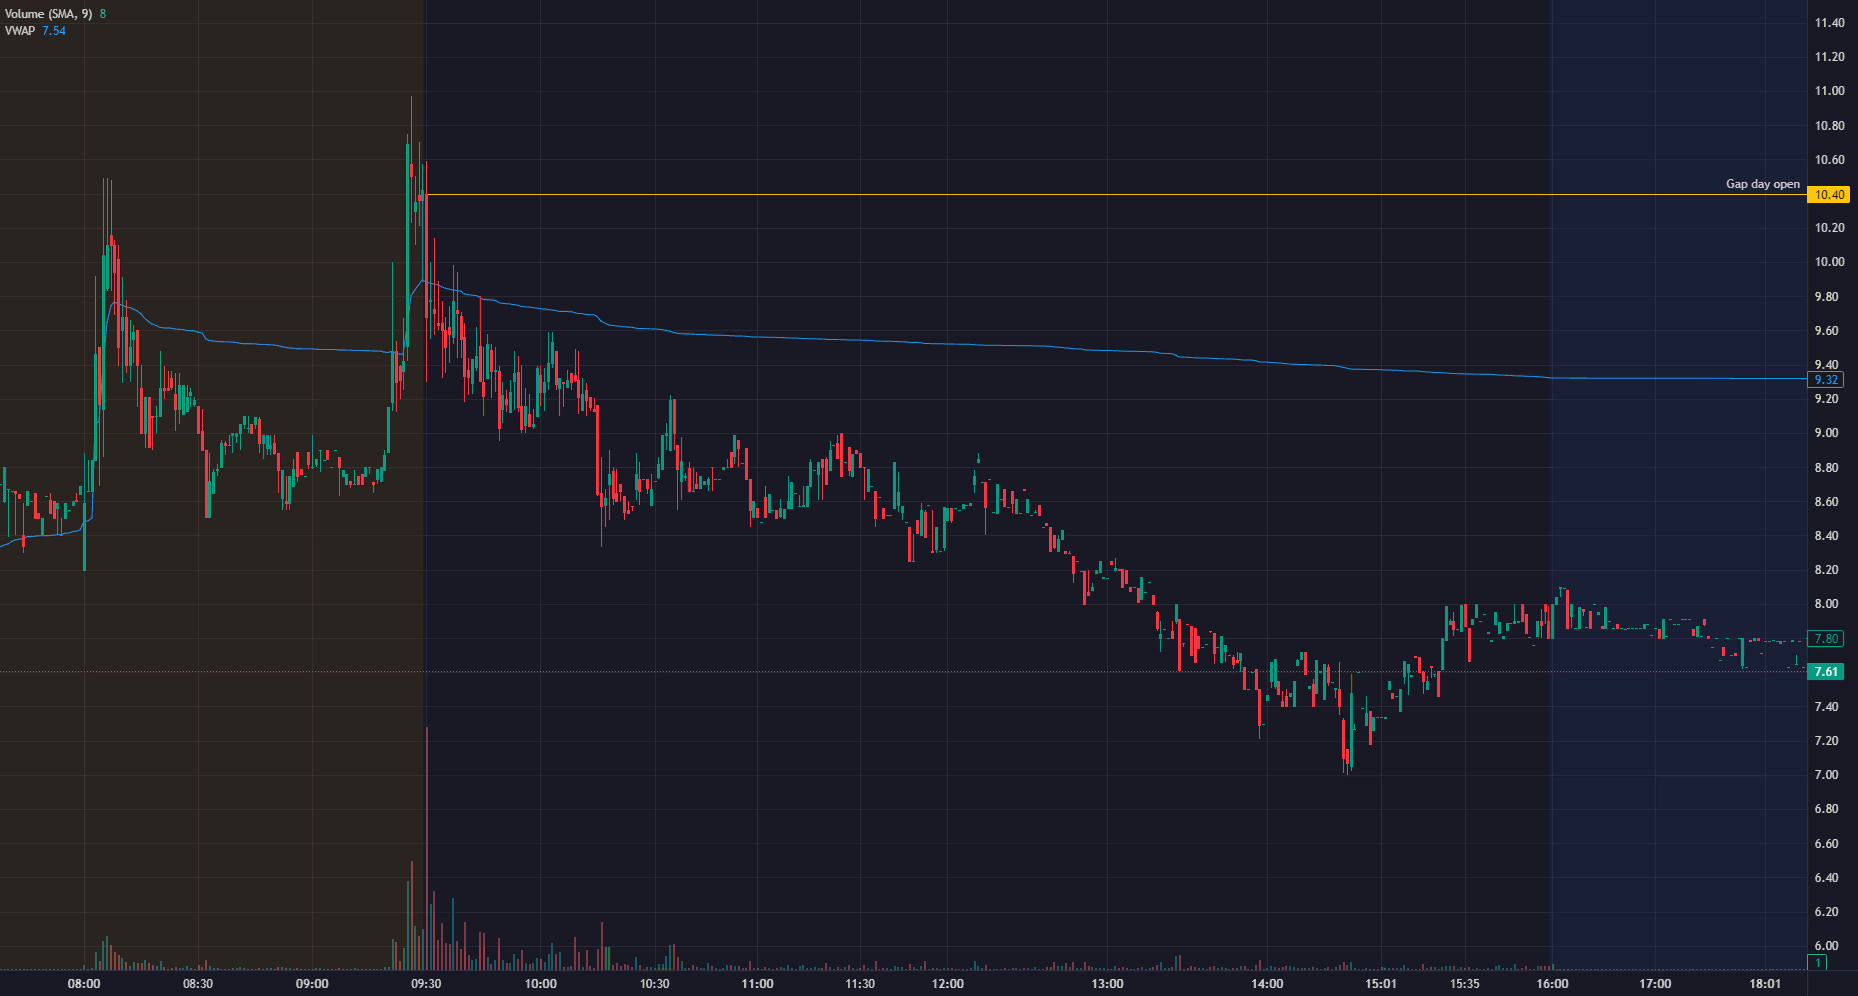
If we want to check every day's price action by its own, we can do it, and we can use lots of different parameters to see data of each day and also differentiate it among Gap day and Day 2.
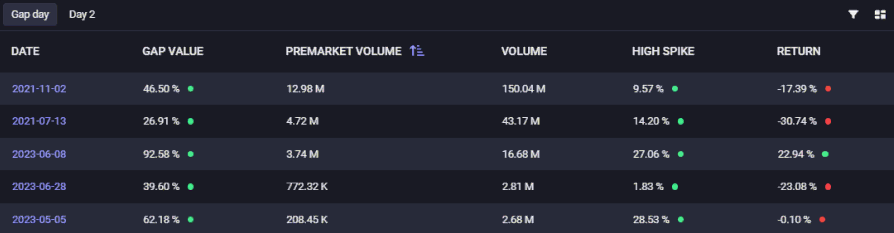
Personally, I like to see the premarket volume. In this case we can see that in the gap day, premarket volume is correlated with session volume, suggesting that when there is attention in premarket, that attention usually remains throughout the session.
Moreover, as we can see in the gap list for $BAOS, a high volume doesn't necessarily equate to runner behavior or a green close, so we can be relatively confident if we are shorting a high volume day.
For example, we can take a look at the gap on 28th June, 2023. Having gone through this information, we can have a greater bias if we see a gap up in this company, at the moment every piece of information is meaningful if we were to elaborate a trade thesis.
Let's look for bigger picture statistics
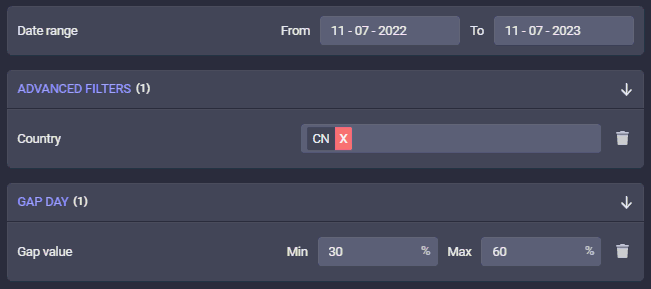
Let's step back and take a look at statistics on Chinese stocks with a gap between 30% and 60% for the last year. In this case, I am using the Flash Research Gap Analysis Tool with the appropriate filters.
Here we can see 53 examples of similar gappers, and very good information comes out:
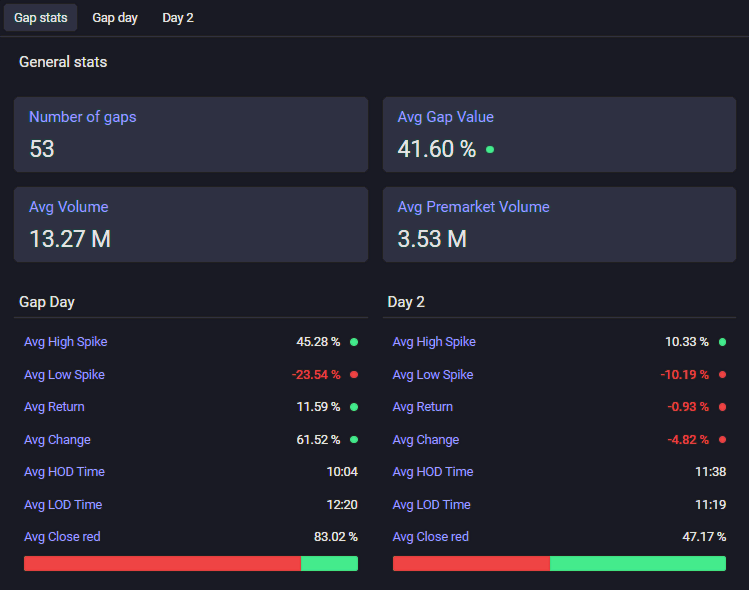
- High Spike: On average, there is a notable increase of 45.28% from the open to the highest price. This shows how far the price could go if it went green straight out in the open.
- Low Spike: Conversely, there is an average decrease of -23.54% from the open to the lowest point. This can be a good statistic to consider for possible targets on short positions.
- Return: They tend to close 11.59% up considering last close.
- Change: The average change in value between two points is 61.52%, indicating substantial fluctuations and potential opportunities for traders.
- HOD Time: Typically, the market reaches its highest point of the day at 10:04, as short sellers we can rely on this number to make better decisions, considering timing.
- LOD Time: Around 12:20, the market tends to hit its lowest point of the day, offering potential time based targets for short sellers.
- Close in Red: On average, gaps with these characteristics close red 83% of times.
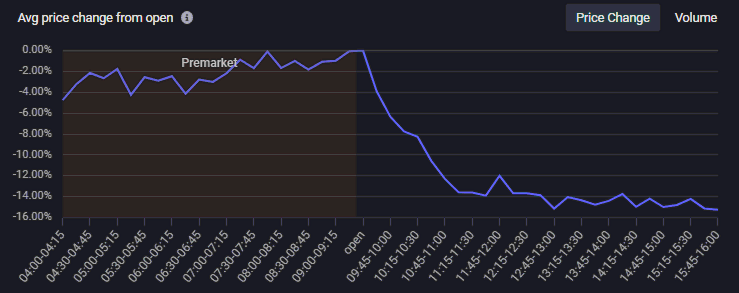
Let's also check the average price change, both premarket and regular hours. We see an almost perfect Gap & Crap behavior over the long run, so clearly the edge is on the short side.
Conclusion
To summarize, our analysis of $BAOS using Flash Research tools reveals important factors such as high insider ownership and a low float. The stock has displayed a consistent pattern of downward movement after each upward run, indicating a bearish sentiment. Gap days show consistent gap and crap behavior and broader statistics of similar gap-up stocks in China highlight a significant tendency for gaps to close in red.
These insights can guide traders in developing short-selling strategies and identifying potential entry and exit points.
However, it is crucial for individual traders to conduct their own research and analysis, considering the inherent risks of trading.